Finding and Using Activity Monitor on Your Mac: A Step-by-Step Guide
Activity Monitor is a powerful built-in utility in macOS that provides insight into your Mac’s performance and resource usage. It allows you to keep an eye on CPU, memory, disk, and network activity, helping you identify and resolve issues that may be slowing down your system.
In this blog post, we’ll guide you through finding and using Activity Monitor on your Mac.
How to Find Activity Monitor on Your Mac
There are multiple ways to locate and open Activity Monitor on your Mac. Here are three common methods:
Using Finder
Open a Finder window and navigate to Applications > Utilities. Inside the Utilities folder, you’ll find Activity Monitor. Double-click it to launch the utility.
Using Spotlight Search
Press Command + Spacebar to bring up Spotlight search. Type Activity Monitor into the search field and press Enter. The Activity Monitor application will open.
Using Launchpad
Open Launchpad by clicking on its icon in the Dock. Type Activity Monitor in the search bar at the top of the Launchpad window. Click on the Activity Monitor icon to open the application.
Using Siri
Activate Siri by clicking on the Siri icon in the menu bar or pressing and holding the Command key and Spacebar. Then, say Open Activity Monitor, and Siri will launch the application for you.
Understanding the Activity Monitor Interface
Once you’ve opened Activity Monitor, you’ll see several tabs at the top of the window: CPU, Memory, Energy, Disk, and Network. Each tab provides detailed information about the corresponding system resource.
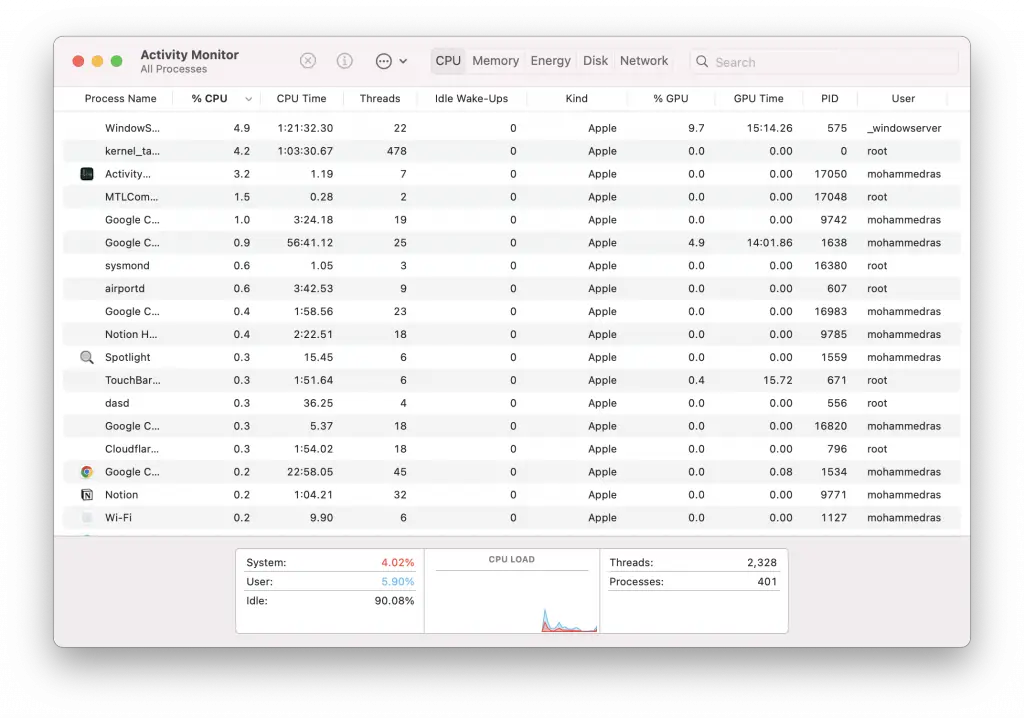
- CPU: Displays the percentage of CPU usage for each running process and the overall system load.
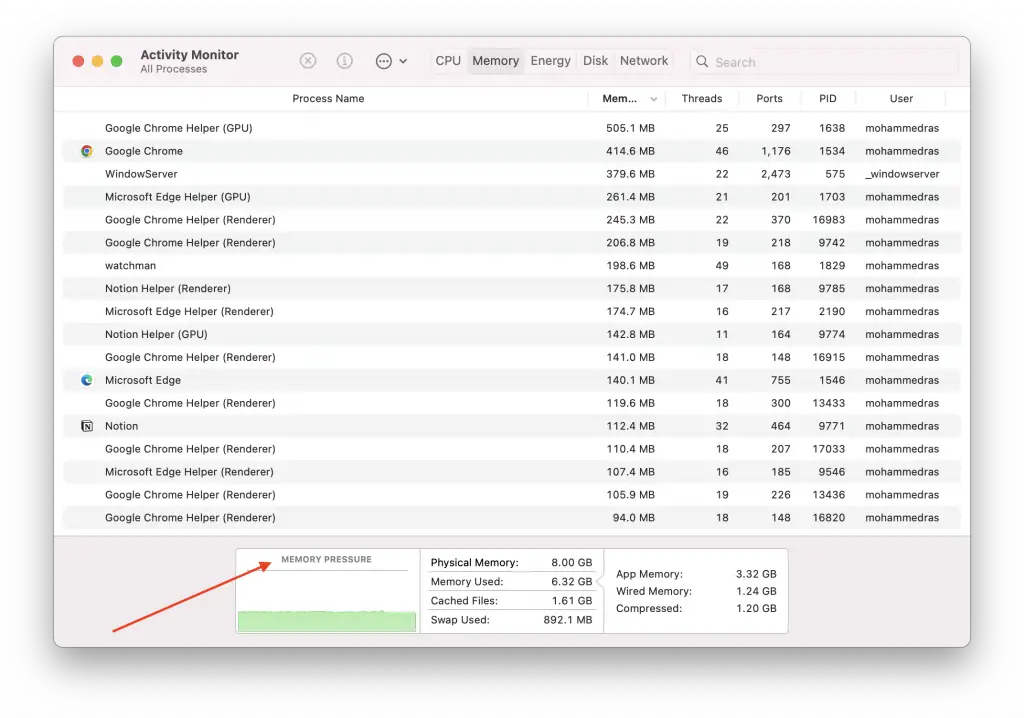
- Memory: Shows the amount of memory used by each process and the distribution of memory usage across different categories.
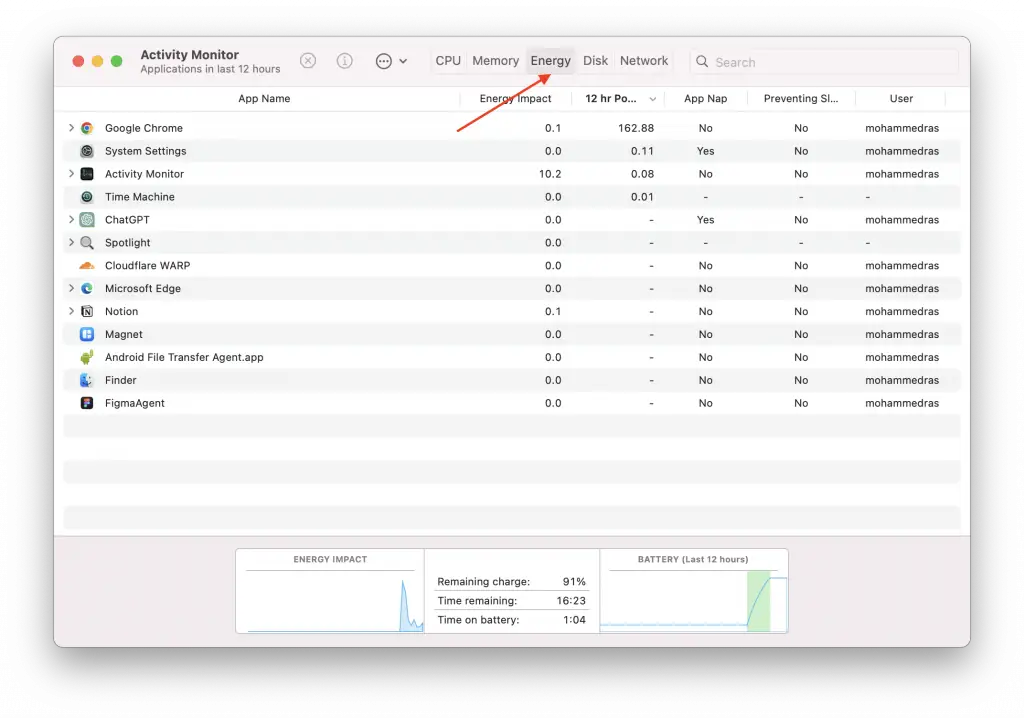
- Energy: Provides information about the energy impact of each process, helping you identify power-hungry applications.
- Disk: Shows the disk activity for each process, including the amount of data read from and written to the disk.
- Network: Displays the network activity for each process, including the amount of data sent and received.
Using Activity Monitor to Diagnose Performance Issues
If you suspect your Mac is running slow or experiencing performance issues, Activity Monitor can help you identify the problem. Here are some tips for using Activity Monitor to diagnose performance issues.
Check for high CPU usage
If your Mac is running slow, it might be due to a process consuming a high percentage of your CPU resources. Look for processes with unusually high CPU usage in the CPU tab and consider quitting them if they’re not essential.
Monitor memory usage
Insufficient memory can cause your Mac to slow down. In the Memory tab, check the Memory Pressure graph at the bottom of the window. If the graph is consistently red, you may need to close some applications or consider upgrading your Mac’s RAM.
Identify energy-intensive applications
If you’re using a MacBook and want to maximize battery life, check the Energy tab to identify power-hungry applications. Close or limit the usage of these applications to save battery life.
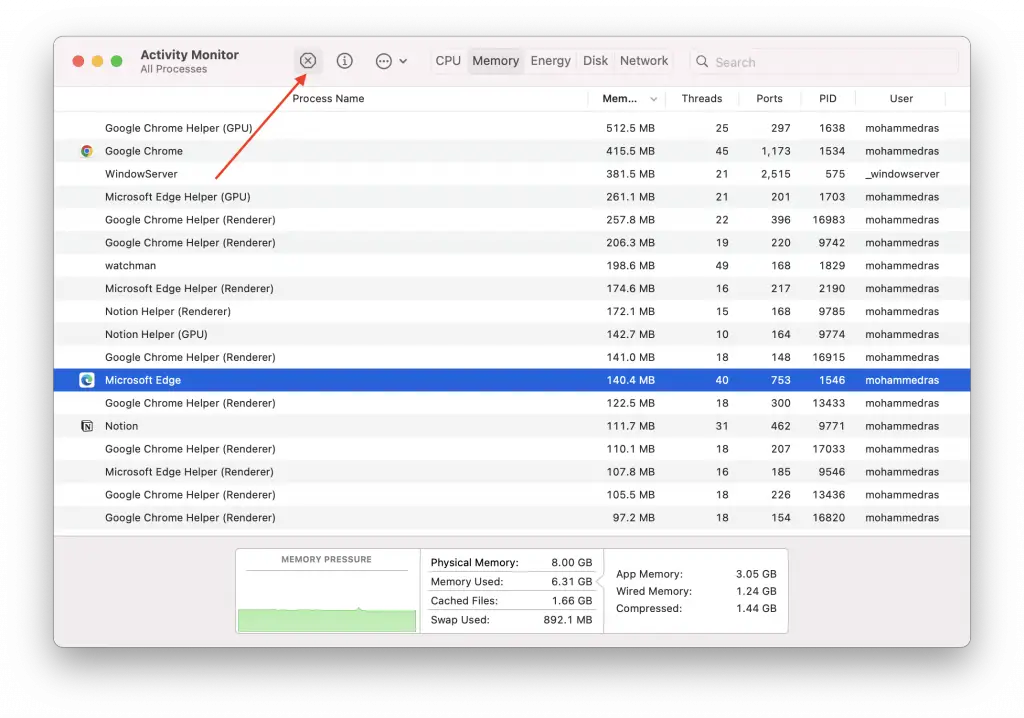
Force Quitting Unresponsive Applications
If you encounter an unresponsive application, you can use Activity Monitor to force quit the process. To do this, select the unresponsive process in the list, click the “X” button in the toolbar, and confirm that you want to force quit the application.
Activity Monitor is a valuable tool for monitoring your Mac’s performance and diagnosing potential issues. By knowing how to find and use Activity Monitor, you can keep your Mac running smoothly and efficiently.
Don’t forget to check for high CPU usage, monitor memory usage, and identify energy-intensive applications to optimize your Mac’s performance further.