How to Open Edge Browser’s Developer Tools
The Developer Tools in Microsoft Edge offer a rich set of functionalities for debugging, inspecting, and improving websites and web apps. This blog post will provide an in-depth guide on how to use these tools to enhance your web development process.
Why Use Developer Tools in Microsoft Edge?
Using Developer Tools can help you:
- Debug JavaScript errors.
- Inspect HTML and CSS elements.
- Analyze network activity.
- Optimize website performance.
How to Open Developer Tools
Method 1: Right-Click Menu
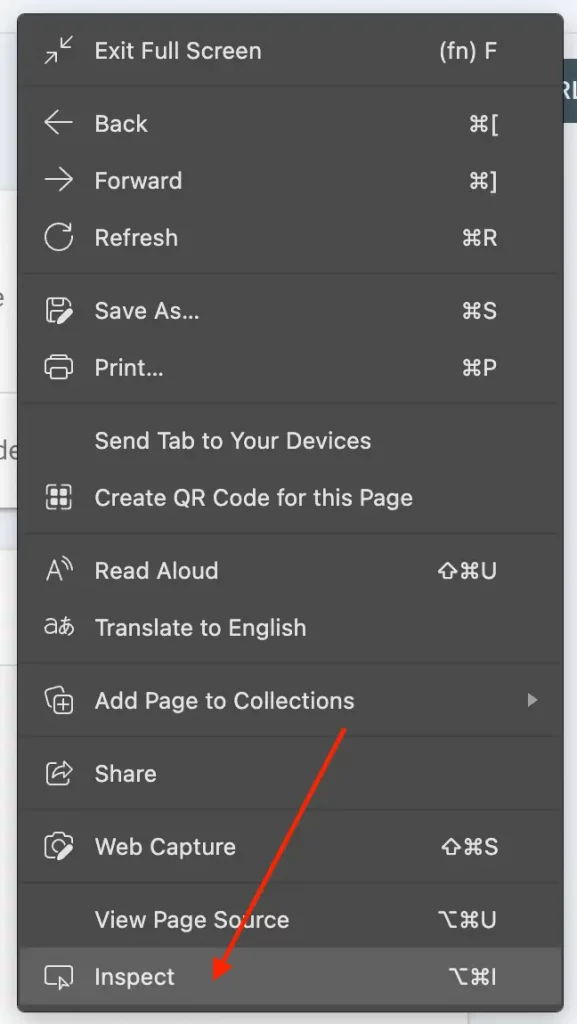
You can open the Developer Tools by right-clicking on any webpage element and selecting “Inspect”.
Method 2: Keyboard Shortcut
Alternatively, use the keyboard shortcut F12 or Cmd+Option+I (Mac) / Ctrl+Shift+I (Windows).
Method 3: Through the Menu
Click on the three horizontal dots in the top-right corner of the browser window, navigate to “More tools”, and then choose “Developer Tools”.

Main Panels
Elements Panel
Use this panel to inspect, modify, and debug HTML and CSS. Select any element on the page, and you’ll see its HTML and applied styles.
Console Panel
Here you can run JavaScript commands. The console displays errors, warnings, and logs to assist in debugging.
Network Panel
This panel allows you to view all network requests made by a webpage. You can sort by type, duration, and other parameters.
Performance Panel
Record and analyze website performance to find bottlenecks and areas for improvement.
Microsoft Edge’s Developer Tools are a valuable resource for any web developer. They offer numerous features to debug, inspect, and optimize websites and web applications. Familiarizing yourself with these tools can significantly streamline your development process.